
The following chart is the result of a data analysis of loan data for 2500 peer lending loans. The caption at the bottom explains the analysis results. This analysis was performed for the course: Data Analysis from Johns Hopkins University offered through Coursera. So far, it is a great experience.
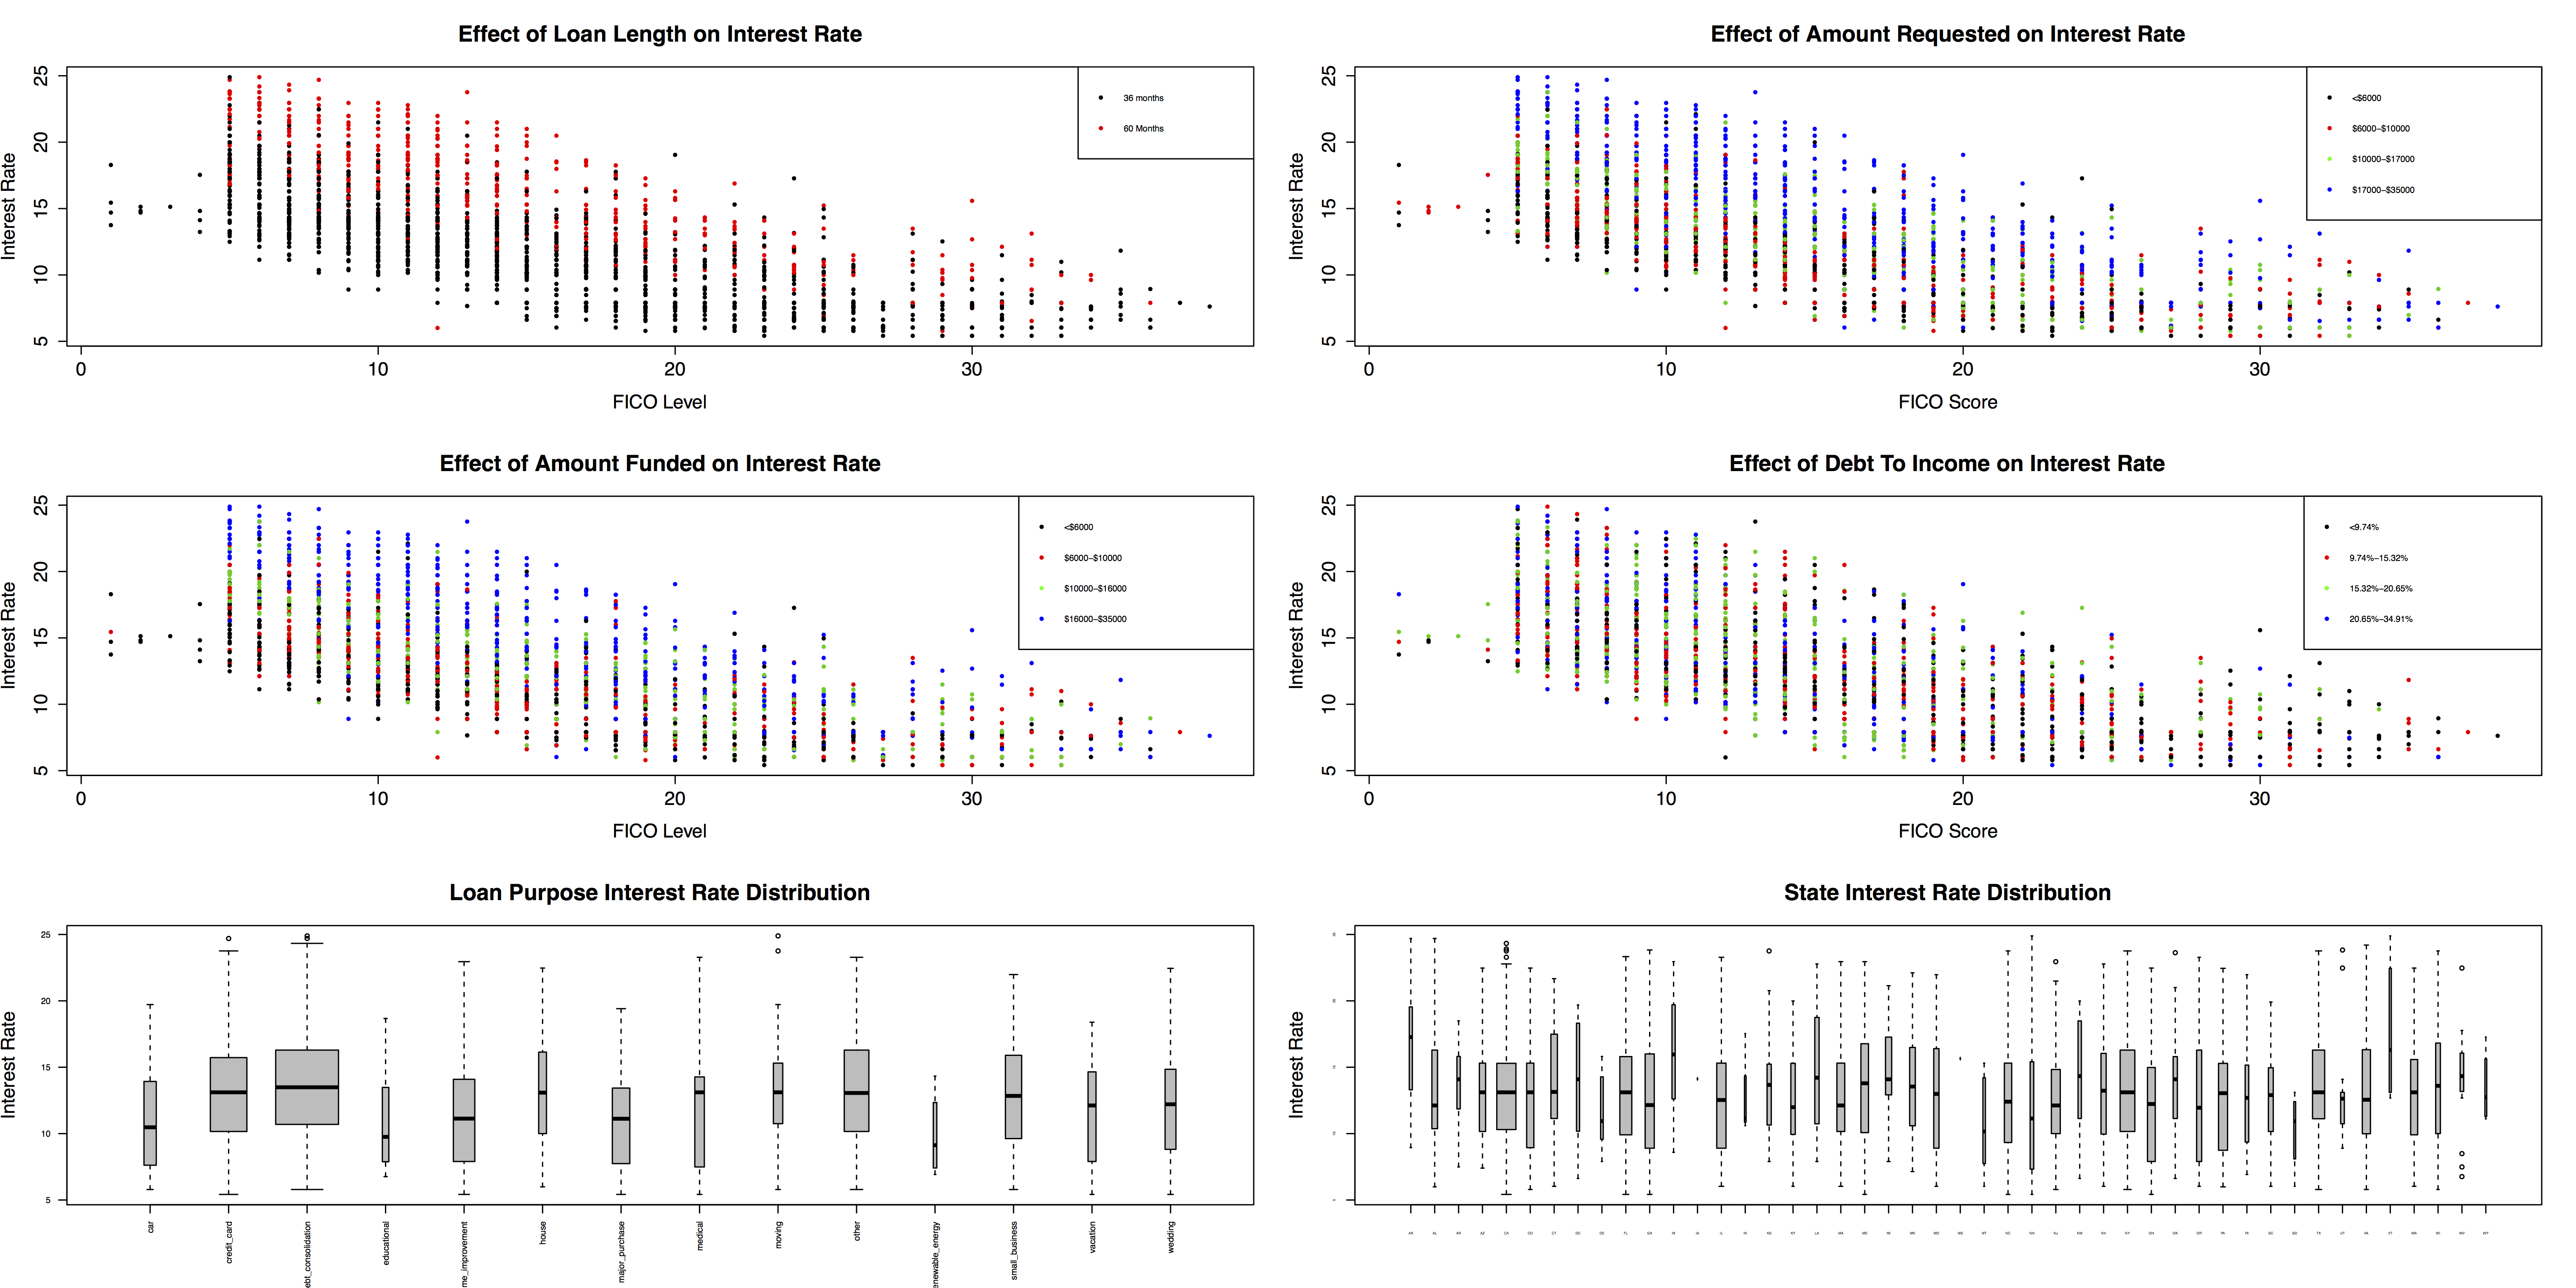
Figure Caption: All of the non-FICO factors that had significant ANOVA p-values are included in the stand-alone figure. Those factors are: (1) loan length, (2) amount requested, (3) amount funded, (4) debt to income ratio, (5) loan purpose, and (6) home ownership. In all charts, interest rate is shown on the Y-axis. Charts 1-3 depict factors confirmed to have significant impact on interest rates using a Tukey-HSD test, while figure 4-6 show factors that had significant ANOVA p-value, but were then determined to have an insignificant impact on interest rate.
The overall correlation between FICO score level and interest rate is negative as seen the overall downward sloping trend of charts 1-3. For non-FICO variables the strongest correlation was a positive correlation found between loan length and interest rate (Chart 1, R2 = 0.180). 60-month loans (red) tend to have higher interest rate than 36-month loads (black) and this can be clearly seen in the chart 1. The second strongest correlation (chart 2) was amounts funded (R2 = 0.114). The third strongest correlation was found to be amount requested (chart 3, R2 = 0.111). To visualize the numerical data of chart 2 and 3 easily, data was grouped into quartiles of dollar value and color-coded. All three of these significant non-FICO variable correlations were found to be positive.
Three charts are also shown for variables that had significant ANOVA p-value results, but were eventually determined to not have significant correlations to interest rates. Chart 4 shows debt to income ratio grouped by FICO score level. Visual inspection shows that there is no clear phasing between the colored points, which were again grouped by quartiles of debt to income ratio. R2-values (R2 = 0.03)confirm an insignificant correlation between the debt to income ratio and interest rates. Chart 5 shows the boxplot for loan purpose distribution. These plots are weighted to indicate the number of observations in the box-width. Although ANOVA showed significant p-value results and Tukey-HSD test showed that some categories of loan purpose had potential significance, loan purpose cannot be considered to impact interest rate strongly because: (1) too few combinations of levels passed the Tukey-HSD test (3 out of 91), (2) some of the levels had very few observations, (3) R2 values were shown to be insignificant (R2 = 0.037). The same is true for home ownership (zero pairs passed Tukey-HSD, R2=0.007).
These results confirm previous academic’s thoughts about correlation significance testing using ANOVA. In general, although ANOVA p-values may indicate significance, Tukey-HSD, R2 values, and visual inspection of the chart may eliminate any expectations of correlation between variables in a multivariate linear regression model.

Leave a comment